Memphis Rental Market Update — Q2 2026
This report is part of our ongoing Memphis Rental Market Update series, where we review federal, independent, and national housing data each quarter to help property owners understand broader market trends and set informed expectations.
The Memphis rental market continues to present a challenging environment for property owners as we enter the final quarter of 2026. New federal vacancy estimates show Memphis moving further above national and regional averages, while independent leasing data reveals that renters are taking longer to make decisions and pricing competition remains significant.
At the same time, rental demand is showing signs of strength. Zillow reports increasing renter activity, while leasing platforms RentEngine and ShowMojo are seeing stronger conversion rates despite fewer overall inquiries.
While some of these figures may seem daunting, they don’t tell the whole story. Property owners can’t control broader market conditions, but they can control how their properties compete within them. Accurate pricing, thorough marketing, and a proactive leasing strategy can make a meaningful difference, even in a challenging market.
The takeaway for property owners? Demand is still there, and positioning a property effectively is more important than ever.
Quick Snapshot: Q3 2026 Market Conditions
The latest available data reveals several important developments:
- Memphis rental vacancy reached an estimated 11.1%, compared with 9.2% across the South and 7.6% nationally.
- Memphis rent growth remains modest, with Zillow reporting a 1.1% year-over-year increase in typical asking rents.
- Renter demand is increasing, with Zillow’s Memphis demand index rising 19% year over year.
- National leasing timelines remain elevated, with ShowMojo reporting an average of 33.8 days on market.
- The first two weeks of marketing are critical, accounting for approximately 45% of rental inquiries in ShowMojo’s research.
- Pricing adjustments remain common, with 28.6% of ShowMojo’s listings requiring a rent reduction.
Together, these findings paint a picture of a market where renters remain active but have considerable choice, making pricing, property presentation, and marketing strategy especially important.
Federal Vacancy Data: Memphis Moves Further Above the National Average
The U.S. Census Bureau’s Q3 2026 Housing Vacancy Survey shows a continued divergence between Memphis and the broader rental market.
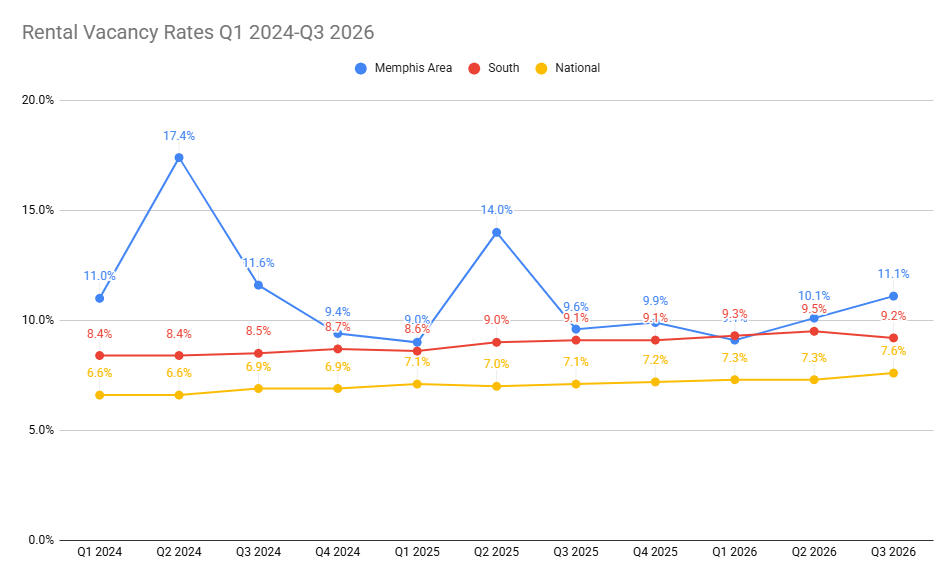
While national vacancy increased slightly during Q3, the South experienced a modest decline. Memphis’s estimated vacancy rate, however, rose to 11.1%, placing it 3.5 percentage points above the national average.
This represents a shift from the beginning of 2026, when Memphis’s estimated vacancy rate was slightly below the Southern average.
However, Memphis has experienced considerable fluctuations in recent years, including vacancy estimates of 17.4% in Q2 2024 and 14.0% in Q2 2025.
It’s also important to recognize that metropolitan vacancy estimates carry relatively large margins of error. Memphis’s Q3 estimate has a margin of error of approximately 4.6 percentage points, meaning individual quarterly changes should be interpreted cautiously.
For property owners, the broader message is that competition remains an important consideration. Higher vacancy can give prospective renters more options, making property condition, pricing, and presentation increasingly influential.
Zillow Rent Trends: Demand Is Growing, but Rent Increases Remain Modest
Zillow’s September 2026 Rent Report provides another perspective on current rental conditions.
One of the most interesting findings is that Memphis renter demand increased 19% year over year, nearly matching national growth. However, local rents increased just 1.1%, considerably below the national rate of 2.7%.
Increased renter demand doesn’t automatically translate into stronger rent growth.
Renters may be actively searching while still having enough available properties to keep pricing competitive.
For Memphis owners, this reinforces the importance of evaluating each property’s location, condition, amenities, and competing inventory rather than relying solely on broader rental trends.
National Leasing Trends: Fewer Inquiries, Stronger Engagement
Q3 2026 reports from ShowMojo and RentEngine reveal that national leasing timelines remain relatively stable, even as properties receive fewer inquiries.
ShowMojo reported an average of 33.8 days on market, approximately one day longer than Q2, while RentEngine reported a median of 28 days, unchanged from the previous quarter. In the South, ShowMojo’s average reached 34.6 days, an increase of 3.2 days year over year.
Both platforms also reported declining lead volume but stronger engagement among prospective renters. ShowMojo recorded a 34.8% inquiry-to-completed-tour conversion rate, its highest on record, while RentEngine found that a greater share of prospects progressed to the application stage.
The takeaway? Fewer inquiries don’t necessarily mean fewer leasing opportunities. Attracting qualified renters and converting their interest into showings and applications matters more than lead volume alone.
Why the First Seven Days Matter
The first week a rental property is on the market is often its most important. Both our industry research and national leasing data show that renter interest is heavily concentrated during the initial marketing period.
RentEngine’s research indicates that approximately 38–40% of rental inquiries arrive within the first seven days. ShowMojo’s Q3 2026 findings reinforce this trend, reporting that 28.6% of inquiries occur during the first week and nearly 45% within the first two weeks.
ShowMojo also found a strong relationship between early showing activity and leasing timelines. Properties receiving six or more tours during their first week leased in a median of just 20 days, compared with 40 days for properties receiving no first-week tours.
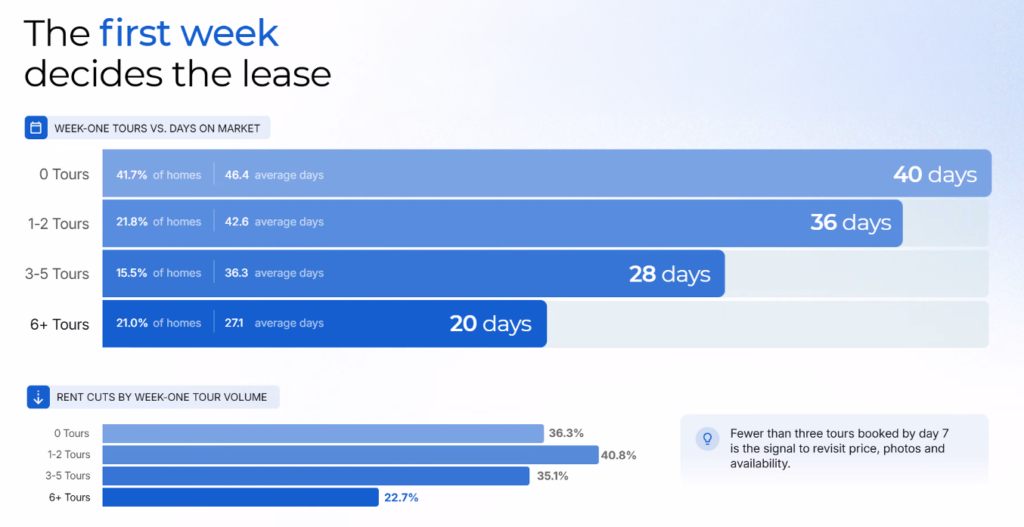
While these findings reflect broader industry data rather than Memphis-specific results, they support an approach we’ve long emphasized at 901 Real Estate Services: the first seven days provide some of the most valuable feedback about a property’s competitive position.
Strong early interest can indicate that pricing and marketing are resonating with prospective renters. Conversely, limited inquiries or showings may signal a need to reassess pricing, presentation, or competing inventory.
By monitoring activity from day one and responding to market feedback early, property owners can make informed adjustments before valuable marketing time is lost.
Looking Ahead: What Owners Should Expect in Q4 2026
As Memphis enters the traditionally slower fall and winter leasing season, property owners should prepare for the possibility of longer marketing periods.
ShowMojo’s historical analysis suggests that average days on market could increase by approximately five days during Q4.
Although market conditions are outside an owner’s control, a property’s competitive positioning is not. Accurate pricing, thorough marketing, timely follow-up, and a willingness to respond to market feedback can all contribute to stronger leasing performance.
At 901 Real Estate Services, we believe successful property management means staying informed, monitoring results, and adjusting strategies as market conditions change.
The goal isn’t simply to achieve the highest possible asking rent. It’s to balance rental income, vacancy exposure, and long-term investment performance.
Sources & Methodology
This report incorporates Q3 2026 data from the U.S. Census Bureau, Federal Reserve Bank of St. Louis (FRED), RentEngine, and ShowMojo, along with Zillow’s September 2026 Rent Report.
U.S. Census Bureau — Housing Vacancy Survey
Federal Reserve Economic Data (FRED)
Zillow Research — September 2026 Rent Report
RentEngine — Q3 2026 Leasing Report
ShowMojo — Q3 2026 Data Talk
Methodology note: Memphis metropolitan vacancy estimates carry significant margins of error. Zillow’s rental figures represent market-wide estimates, while RentEngine and ShowMojo findings reflect their respective platform datasets rather than Memphis-specific leasing performance. Data reflects information available as of October 28, 2026.