This report is part of our ongoing Memphis Rental Market Update series, where we review federal, independent, and national housing data each quarter to help property owners understand broader market trends and set informed expectations.
Quick Snapshot: Q2 2026 Market Conditions
In our Q1 2026 update, we discussed elevated vacancy, slower rent growth, and increased competition among landlords across Memphis and the broader Southern rental market. As we move into Q2 2026, the newest available data continues to support that same conclusion: vacancy remains elevated, concessions remain common, and pricing discipline matters more than ever.
While spring leasing activity often creates the expectation that the market will naturally “correct itself,” current federal and independent reporting shows that supply pressure remains strong. More leads do not necessarily mean stronger market conditions, and many owners are still facing longer leasing timelines, pricing resistance, and increased competition from comparable inventory.
This update draws from objective third-party sources, including U.S. Census Housing Vacancy Survey data, Federal Reserve Bank of St. Louis reporting, and Zillow rental market analysis, to provide a clearer picture of what owners should expect heading into the second half of 2026.
Quick Snapshot: Q2 2026 Market Conditions
Based on trends observed through Q1 2026 and the most recent finalized reporting, the Memphis rental market continues to be defined by:
- Elevated vacancy
- Slower rent growth
- Increased competition among landlords
- More frequent concessions and move-in specials
- A tenant-competitive leasing environment
These conditions directly impact pricing strategy, days on market, and owner expectations.
Federal Vacancy Data: Elevated Vacancy Is Persisting
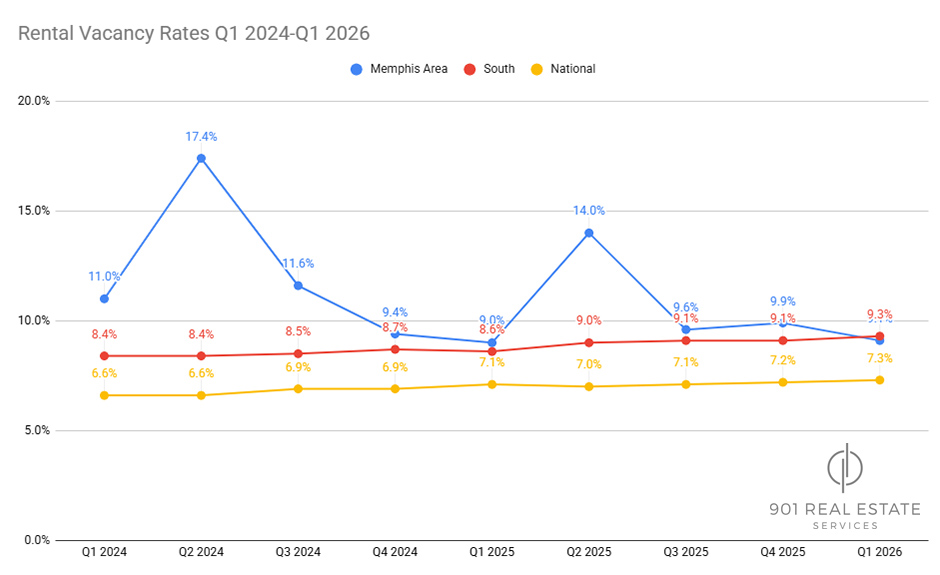
According to the U.S. Census Bureau Housing Vacancy Survey (HVS), the South remains the highest-vacancy rental region in the country, and Memphis continues to reflect those same softer leasing conditions.
Q1 2026 Rental Vacancy Rates
- United States overall: 7.3%
- South region: 9.3%
- Memphis metro: 9.1%
While national vacancy has risen gradually since the unusually tight post-pandemic market of 2021–2022, Southern rental markets continue to experience significantly more supply pressure than the rest of the country.
That gap matters. Memphis is not operating in a low-vacancy environment, and owners should be cautious about relying on generalized national headlines suggesting a “tight” rental market.
Memphis Vacancy Trends: The Bigger Local Picture
Vacancy rates in Memphis have remained elevated for multiple years and continue to reflect a tenant-competitive market rather than a landlord-dominant one.
Memphis Rental Vacancy Rates
Even with some quarter-to-quarter improvement, vacancy remains well above what would typically be considered a tight rental market. Large fluctuations also point to ongoing supply-and-demand imbalance rather than steady absorption. Spring leasing activity may create more movement, but it has not meaningfully eliminated the broader vacancy pressure owners are still feeling.
Federal Reserve Context: This Isn’t Just a Memphis Issue — But It’s More Pronounced Here
Data published through Federal Reserve Bank of St. Louis shows the national rental vacancy rate increased to 7.3%. Vacancy rates have been gradually rising across the country since the unusually tight post-pandemic market of 2021 and 2022, but Memphis and the broader South continue to experience even more supply pressure than the national average.
While Memphis dipped slightly below the Southern regional vacancy rate this quarter, with Memphis at 9.1% compared to the South at 9.3%, the bigger picture still shows a market with consistently elevated vacancy and significant volatility. Over the past several years, Memphis has seen major swings, including spikes as high as 14.0% in 2025 and 17.4% in 2024.
That history matters. While vacancy rates may be trending in a healthier direction for now, it would not be unreasonable to see additional upward pressure in future quarters, especially as new housing supply and multifamily development continue coming online.
This reinforces an important point for owners: national headlines about housing shortages often do not reflect local rental realities. In Memphis, pricing strategy, property condition, and neighborhood-level competition matter far more than broad national narratives.
Zillow Rent Trends: National vs. Memphis
Zillow’s February 2026 Rent Report supports the same conclusion from another angle: renters have gained more negotiating power, and Memphis continues to reflect the same slower-growth environment seen nationally.
National Signals
- Typical U.S. asking rent: $1,895/month
- Annual rent growth: +1.9%
- Nearly 40% of listings offered concessions
That annual growth rate represents the slowest rent growth since late 2020, while widespread concessions continue to signal strong competition among landlords.
Move-in specials like waived fees, discounted first months, and reduced deposits are no longer rare exceptions. In many cases, they have become standard leasing tools.
Memphis Metro Trends
- Typical rent (ZORI): approximately $1,401/month
- Month-over-month change: –0.3%
- Year-over-year rent growth: approximately +1.9%
Memphis mirrors the broader national trend: rent growth remains positive, but it is modest, and landlords are facing more resistance when pricing aggressively.
The month-over-month decline is especially important because it shows that even during the spring leasing season, renters are still pushing back against pricing that does not align with market expectations. This reinforces what many owners are already experiencing: longer leasing timelines, more competition from nearby comparable listings, and a greater need for pricing discipline from the start.
In a higher-vacancy environment, the goal is not simply to list higher and wait. The goal is to lease efficiently, minimize vacancy loss, and stay competitive against the properties renters are comparing side by side.
Leasing Behavior: Why the First 7 Days Matter Most
Vacancy rates help explain the broader market, but leasing behavior data helps explain what owners actually experience when a property hits the market. Independent national leasing performance data from RentEngine shows that pricing strategy at launch often has a bigger impact than later price reductions.
National Leasing Performance Trends
- Average days on market: 31.6 days
- 31% of all leads arrive within the first week on market
- 59.1% of properties required at least one price reduction
- Average number of price reductions: 2.3
- Average total price reduction: $99.37
- Properties that require even one price reduction often stay on market 11+ additional days
- Average days on market since the latest price change: 20.8 days
This is one of the most important realities for owners in a high-vacancy market.
The first week of a listing is still the strongest leasing window. According to RentEngine’s Q4 2025 leasing data, 31% of all renter leads arrive within the first week on market. That early momentum matters because more than half of listings, 59.1%, required at least one price reduction, and the average property needed 2.3 price reductions before leasing.
When a property launches overpriced, owners often lose their best opportunity to capture serious renter attention before the listing begins to age.
By the time pricing adjustments happen, the property may already feel stale to prospective tenants, even if the home itself is still competitive. RentEngine reports that the average property spent 20.8 days on market after its latest price change, reinforcing how costly delayed pricing decisions can become.
This is especially important in Memphis, where elevated vacancy means renters have more choices and less urgency. Competing listings, concessions, and neighborhood-level differences all make accurate pricing from day one significantly more important than trying to “test the market” at a higher number. In many cases, pricing correctly upfront protects owners from a longer vacancy period far more effectively than multiple later reductions.
More showings do not always mean stronger demand, and fewer showings often tell the clearest story: the market is responding to price.
How 901 Management Helps Owners Navigate This Market
In a market where vacancy remains elevated and renters have more choices, successful leasing depends on strategy, speed, and strong execution.
We help owners stay competitive through:
- Pricing decisions based on real market activity, not guesswork
- Agent-led showings that provide meaningful feedback from prospective tenants
- Fast response systems that protect leasing momentum during the critical first week
- Clear communication and realistic expectations from onboarding through lease-up
- Ongoing adjustments based on market response, not assumptions
In a higher-vacancy environment, the goal is not just to fill a property, it is to lease efficiently, minimize vacancy loss, and protect long-term performance.
If you’re evaluating your rental strategy this year, we’re here to help you make informed decisions with clarity and confidence.