
This report is part of our ongoing Memphis Rental Market Update series, where we review federal, independent, and national housing data each quarter to help property owners understand broader market trends and set informed expectations.
What We’re Seeing as We Enter 2026
As with most early-year rental market reports, this update is based on the most recent finalized data available, much of which reflects rental activity observed in late 2025 and continuing into early 2026.
Federal and independent sources — including U.S. Census vacancy data and Federal Reserve reporting — are published on a delayed, quarterly schedule. As a result, Q3 2025 represents much of the latest confirmed vacancy data at the time of this report and remains a reliable indicator of early-Q1 market conditions.
What Late-2025 Data Is Telling Us as We Enter the New Year
As we move into Q1 2026, rental market commentary often points to “tight” conditions or low vacancy. However, when we step back and review neutral, third-party data, a more nuanced picture emerges for the Memphis rental market.
This update draws from federal and independent research sources, including U.S. Census data, Federal Reserve reporting, and national rental market analysis, providing some of the most objective insights available into rental supply, demand, and pricing trends.
🔍 Quick Snapshot: Early Q1 2026 Market Conditions
Based on trends observed at the end of 2025 and continuing into early 2026, the Memphis rental market can best be described as:
- Elevated vacancy
- Moderate to slow rent growth
- Increased competition among landlords
- A tenant-competitive environment
These conditions matter — especially for pricing, leasing timelines, and expectations during the first part of the year.
🏛️ Federal Vacancy Data: A Clear Market Signal
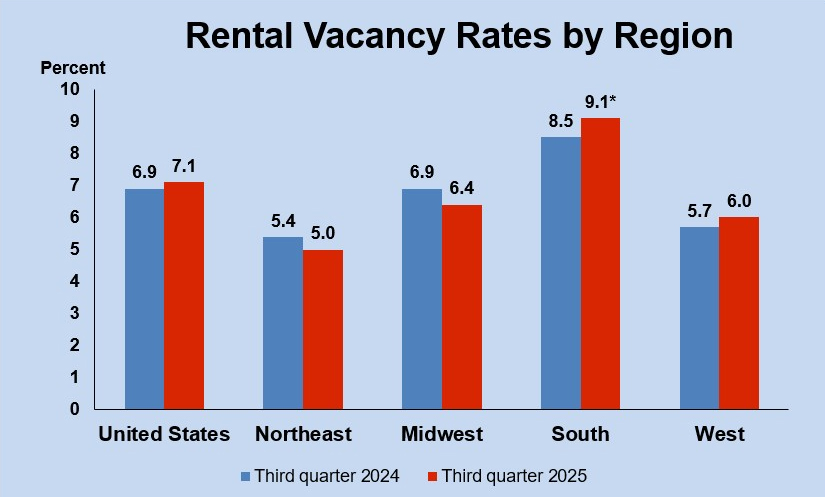
According to the U.S. Census Bureau Housing Vacancy Survey (HVS), rental vacancy rates across the South — and in Memphis specifically — remain structurally higher than the national average.
Regional & National Context
- Q3 2025 rental vacancy rate (South): 9.1%
- U.S. overall rental vacancy rate (Q3 2025): 7.1%
Southern rental markets have historically experienced higher vacancy, and current data confirms that trend continues.
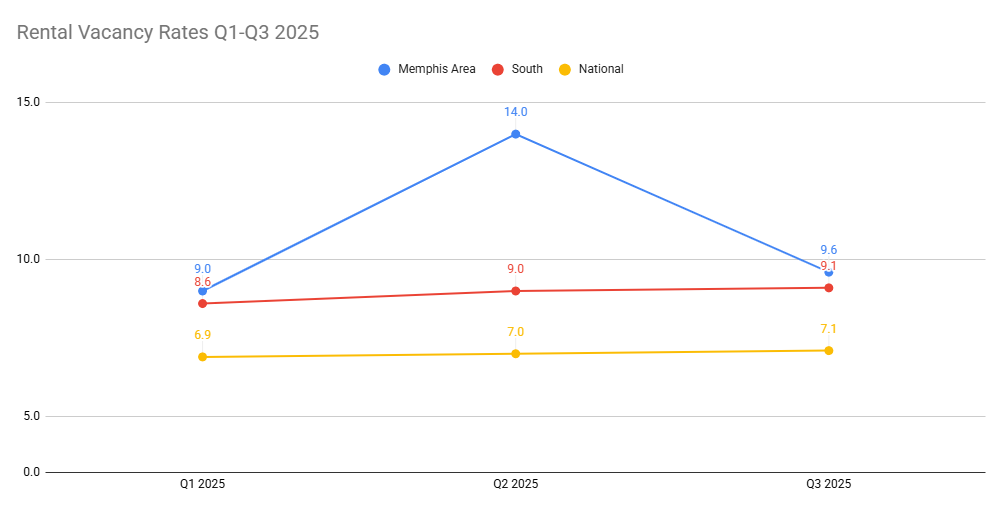
Memphis Metro Vacancy Trends (TN–AR–MS)
Memphis vacancy rates in 2025 were both elevated and volatile:
- Q1 2025: 9.0%
- Q2 2025: 14.0%
- Q3 2025: 9.6%
These levels are well above what would typically be considered a “tight” rental market. Large quarter-to-quarter swings point to supply-and-demand imbalance, rather than steady absorption.
📉 Federal Reserve Context: Not Just a Memphis Issue — But More Pronounced Here
Data published by the Federal Reserve Bank of St. Louis (via FRED) shows that:
- National rental vacancy reached 7.1% in Q3 2025
- Vacancy rates have been trending upward since 2022, reversing the unusually tight post-pandemic period
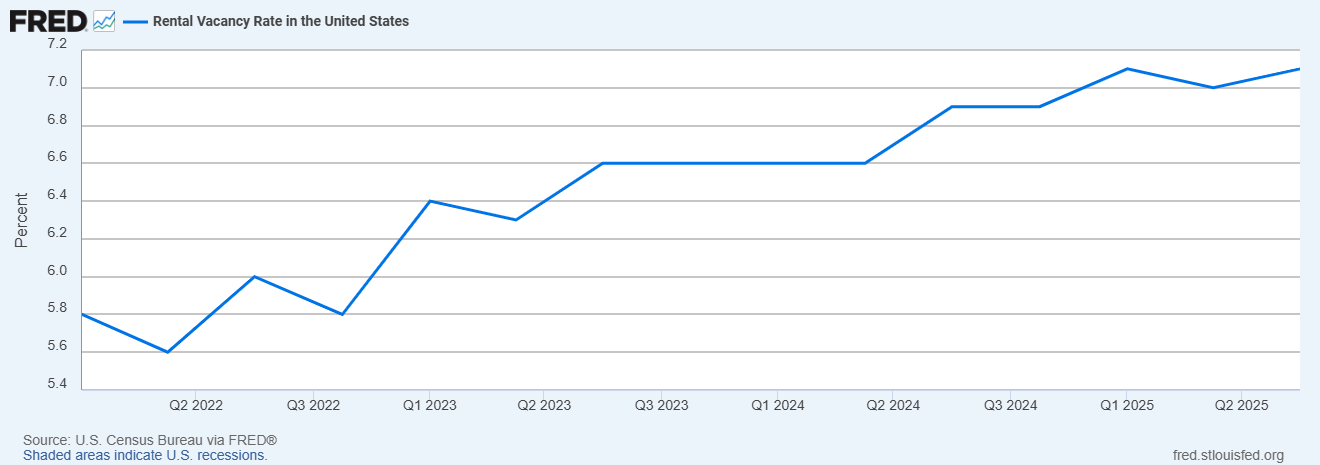
While vacancy is rising nationally, Memphis remains materially above the U.S. average, reinforcing that local conditions are softer than many generalized market narratives suggest.
🏘️ Zillow Rent Trends: Market Behavior Confirms the Data
While Zillow does not publish direct vacancy percentages, its rent and concessions data strongly supports the same conclusion.
According to the Zillow Research December 2025 Rent Report:
National Signals
- 39.5% of rental listings offered concessions
- Rent growth slowed significantly, reflecting increased competition among landlords
Memphis Metro (ZORI)
- Typical rent: ~$1,401
- Month-over-month change: –0.3%
- Year-over-year growth: ~1.9%
Slowing rent growth and widespread concessions are consistent with higher vacancy and excess supply, aligning closely with Census and Federal Reserve data for the Memphis metro.
🧠 Big-Picture Takeaways for Q1 2026
When viewed together, independent federal data and national rental market research tell a consistent story:
- Memphis has experienced elevated rental vacancy for several years
- 2025 vacancy rates ranged roughly 9%–14%, well above national averages
- Claims of “low vacancy” are not supported by Census or Federal Reserve data
- Rent growth remains positive but muted
- Competition is strongest for older, less-differentiated inventory
In short, this is not a landlord-dominant market — and strategy matters more than ever.
If you own a rental property in Memphis, understanding vacancy trends is critical to pricing, marketing, and tenant retention. Learn how our Memphis-based team approaches leasing strategy in a high-vacancy environment here:
👉 Memphis Property Management Services
🧭 What This Means for Property Owners
In a tenant-competitive environment, successful leasing depends on:
- Accurate pricing from the start
- Property condition and readiness
- Willingness to respond to real market feedback
- Data-driven adjustments, not assumptions
This is exactly why we rely on agent-led showings, consistent feedback loops, and objective market data when advising owners — not anecdotes or industry hype.
🔮 Looking Ahead
As we move deeper into Q1 and toward Q2 2026, we’ll continue monitoring vacancy trends, rent movement, and tenant behavior as more current-year data becomes available.
Markets shift — but clarity, preparation, and informed decision-making remain constant advantages.
🤝 How 901 Management Helps Owners Navigate This Market
In a higher-vacancy environment, strong property management isn’t about optimism — it’s about precision.
We help owners stay competitive through:
- Market-aligned pricing strategies
- Agent-led showings with real feedback
- Clear onboarding expectations in the first 90 days
- Ongoing communication driven by data, not noise
If you’re navigating leasing decisions this year, we’re here to help you do it with clarity and confidence.
Editorial Note
As with most early-year market updates, this report reflects trends observed at the end of 2025 and continuing into early 2026. This post may be updated as additional Q1 2026 data becomes available.